tree day
Guide
How to map neighbourhood shade?
A practical way to record where shade falls, when it matters, and who can use it—so residents can distinguish a useful cooling route from a map that merely marks trees.
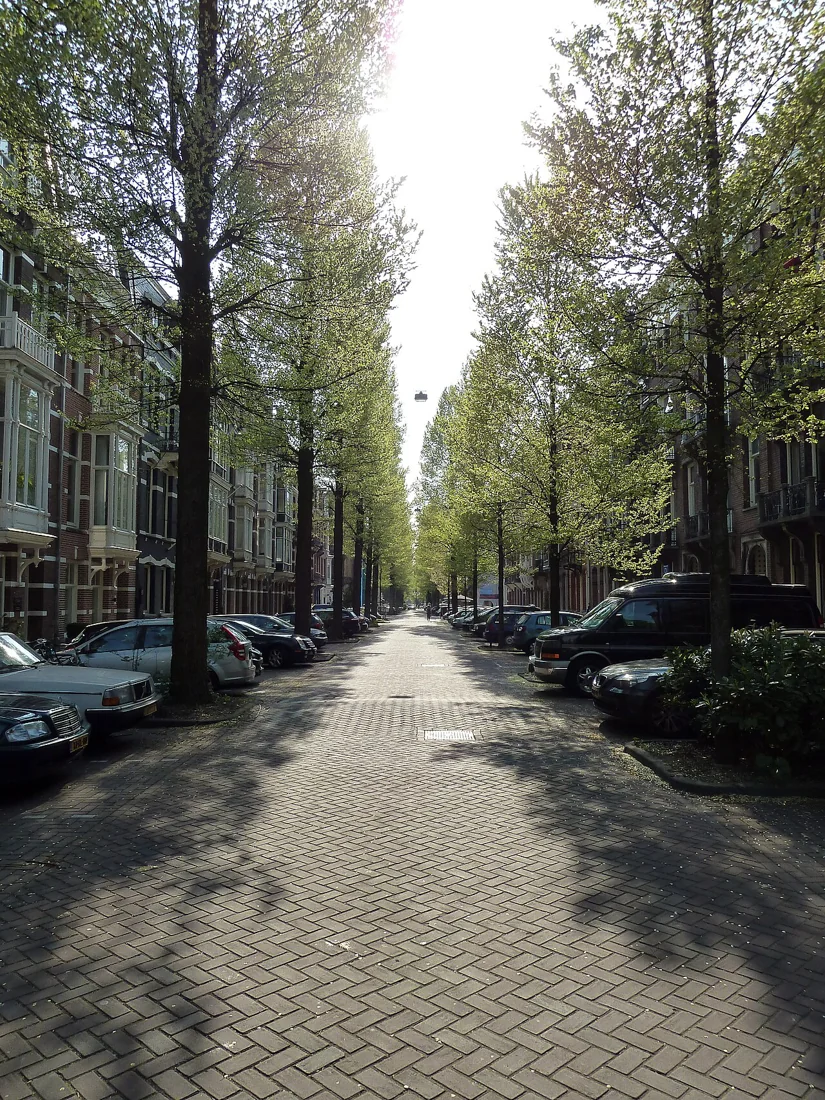
To map neighbourhood shade, walk the same streets at a few relevant times of day and record where a person can actually stand or move out of direct sun. A tree symbol alone is not enough: canopy size, building shadows, benches, sidewalk gaps and the season all affect whether a route feels shaded. A simple, consistently observed map can help residents explain where shade is missing and what kind of response might fit.
Choose the question before the route
Start with a decision the map could inform. Are you trying to identify a sunny stretch between a bus stop and a library, find places to pause on a walk, or show where shade is scarce around a school entrance? A narrow question makes the observations useful. Mapping every tree in a neighborhood may be interesting, but it does not necessarily reveal where people need relief during a hot walk.
Choose a small area and a route people use. Include destinations and crossings, not just attractive blocks. If the concern is heat exposure, observe during warm conditions when possible; an overcast or cool day cannot show the same pattern. Keep a note of date, approximate time, cloud cover and recent weather so readers understand what the map records.
Record shade people can reach
Use a printed street map or a shared digital map with a simple legend. Mark continuous shade, partial shade, and exposed stretches separately. Add places to pause, such as a seat, broad verge or sheltered public entrance, but distinguish these from places that are merely shaded. A shaded wall may not offer a safe or comfortable place to stop; a tree canopy over a sidewalk may do so if the path remains clear.
Walk at a steady pace and note the shaded side of the street. Record whether shade covers the walking surface or only a nearby yard. Include obstacles that change access, such as a narrow sidewalk, stairs, missing curb ramps or a busy crossing. The goal is not to rate a block as good or bad; it is to make the conditions legible to someone who did not join the walk.
Repeat observations at useful times
The sun moves, and a map made at one hour is a snapshot. If residents are concerned about an afternoon trip, revisit then; for a morning school journey, observe near that time. A few repeated walks can reveal whether a building provides reliable shade, whether a tree shades the sidewalk only briefly, and where the route stays exposed. Repeat in a different season if the decision depends on leaf cover, because deciduous trees change their shade through the year.
For example, imagine a route from an apartment complex to a bus stop. One walk finds a shaded bench but an exposed crossing immediately before it. A second walk later in the day shows the bench has moved into sun, while a nearby building shades the crossing. The map should show those distinctions instead of marking the entire block as shaded.
Make the map readable and fair
Give each symbol a short definition, and include a date and observation times on the map. Avoid implying that a few volunteers have measured temperature or proven a health effect. This is an observation map, not a heat sensor survey. If participants use different mobility aids or walk at different speeds, invite them to note whether shade and resting places are usable for them; the same route can present different burdens to different people.
Ask people who live or travel in the area to review the map before sharing it. Their knowledge may reveal a frequently used shortcut or a place that feels unsafe to stop. Do not map private yards as public amenities, and avoid collecting personal details that are unnecessary to the project.
Turn gaps into a next step
A shade map can support a request for a site visit, a discussion about street trees, or a search for a temporary shaded waiting place. Trees and other vegetation can cool urban areas, and public agencies consider local approaches to increasing them; the map helps describe where residents experience a gap, rather than deciding a planting plan by itself. [2]
A useful next action is to pick one exposed segment, attach the dated observation notes, and ask the responsible local department what options fit that site. Trees need suitable space and ongoing care, while other constraints may also shape a street. If the issue is runoff as well as shade, note it separately: green infrastructure can filter, infiltrate or evapotranspire rainwater where it falls, but those functions require their own site assessment. [1]
Follow the evidence
Primary sources used in this story. Practical examples are illustrative unless a source states otherwise.
Read our editorial standards. Have a correction? Identify the article and relevant source in your feedback to the site owner.